

Third of five posts on AI gateways. Before: why it exists and how to build it. After: where local models fit.
Summary
- LiteLLM overhead: ≈ 10 ms at sequential p50, ≈ 45 ms at 10 connections. Docker network hop isolated beforehand at 0.43 ms.
- Against a real model call, which takes hundreds of milliseconds to several seconds, that's noise. Against a fast local model, it dominates.
- OpenRouter is not an alternative to the gateway. The right arrangement is declaring it as a provider inside it.
- If 10 ms is unacceptable for your case, the answer is Bifrost, not LiteLLM — and the reason is the GIL.
1. Why measuring this matters
The decision to put a layer between the application and the model is usually argued on governance, and there are good arguments on that side. But it adds a hop to the production path, and nobody publishes what that hop costs.
It matters because the answer changes with the destination. Adding 10 ms to a 2-second call is 0.5%. Adding 10 ms to an 80 ms call to a local model is 12%. The same layer is irrelevant in one case and expensive in the other.
2. The method
The problem with measuring proxy overhead is that provider latency dominates everything and hides what you want to see. Measuring against OpenAI's API would have measured the internet.
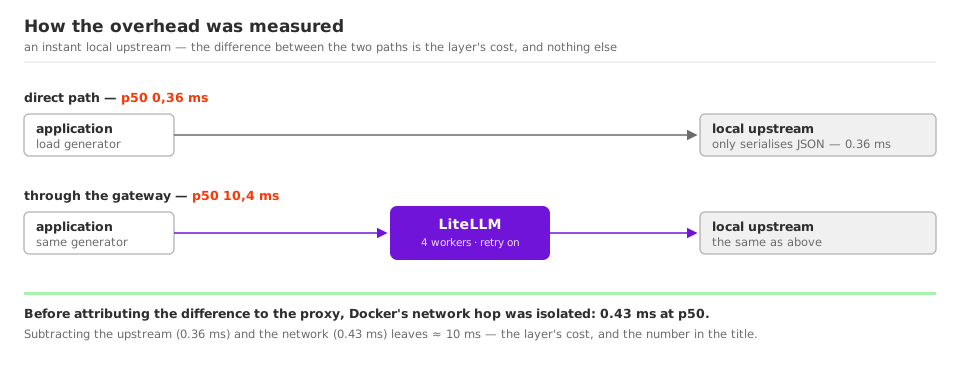
So I put LiteLLM in front of a local OpenAI-compatible upstream that responds in 0.36 ms. It's instantaneous on purpose: that way the difference between the two paths is the cost of the layer and nothing else.
Before that, I isolated the network. Running from inside the container to the upstream, the Docker network hop came out at 0.43 ms p50. Without that control, any number afterwards could have been Docker NAT rather than proxy processing.
3. The numbers
3.1 End-to-end latency
| scenario | path | p50 | p95 | p99 | max |
|---|---|---|---|---|---|
| sequential | direct | 0.36 ms | 0.45 ms | 0.56 ms | 0.55 ms |
| sequential | via LiteLLM | 10.4 ms | 51.5 ms | 53.2 ms | 55.8 ms |
| 10 connections | direct | 2.38 ms | 3.66 ms | 4.73 ms | — |
| 10 connections | via LiteLLM | 47.0 ms | 57.0 ms | 63.4 ms | — |
3.2 What is left after discounting the rig
| measurement | value | what it is |
|---|---|---|
| local upstream response | 0.36 ms | the floor: a server that only serialises JSON |
| Docker network hop | 0.43 ms | container → host, measured from inside |
| proxy overhead, sequential p50 | ≈ 10 ms | the remaining difference, and the number in the title |
| direct path degradation under load | 6.6× | this is the rig saturating, not the proxy |
3.3 How to read each row
| row | supports what |
|---|---|
| sequential p50 | yes — one request at a time, nothing contending for CPU |
| sequential p95/p99 | partly — the tail comes from the retry policy, not the layer |
| 10 connections, any percentile | not on its own — measures proxy and rig together |
Conditions: main-stable image, 4 workers, default config with retries on, load generator on the same host, Linux development machine. One run, no replication — which is why the numbers are rounded to two significant figures, and why quoting them more precisely would be false.
4. How to read the result
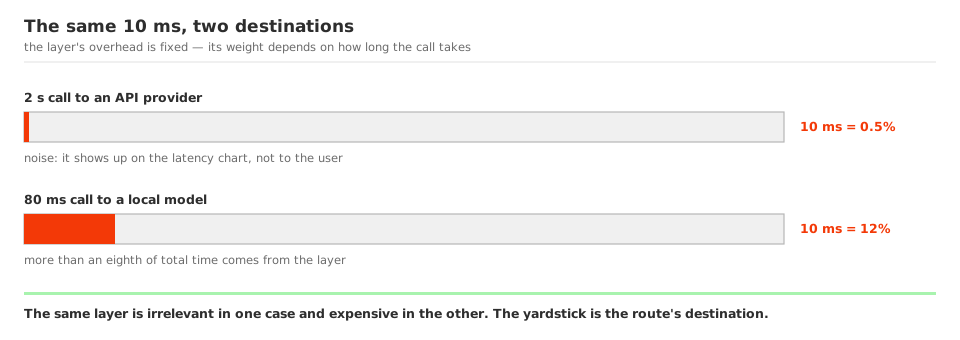
A real model call takes hundreds of milliseconds to several seconds. Adding 10 ms to that is noise — it shows up on a latency graph, it doesn't show up for a user.
The math changes in two cases:
- A fast local model. If you route to a small Qwen or Llama answering in 80 ms, the layer becomes more than an eighth of total time.
- High volume on thin margins. Ten milliseconds per request, across millions of requests, becomes CPU and becomes an invoice.
In neither case is the answer to drop the layer. It's to change the layer.
5. If 10 ms is too much
LiteLLM is written in Python, so per-process throughput hits the GIL. The number in section 3 is a direct consequence of that, not an implementation defect.
The options, and the criterion for each:
| gateway | what it is | choose it for |
|---|---|---|
| LiteLLM | MIT, 100+ providers behind an OpenAI-compatible endpoint, virtual keys, per-team budgets, fallbacks, admin UI | Coverage. The most complete on compatibility and the most direct to operate |
| Bifrost | written in Go, built for minimal overhead and high throughput; less provider coverage | Latency. If those 10 ms genuinely bother you, this is where you go |
| Portkey | the gateway went Apache 2.0 in March 2026; the governance platform around it stays proprietary, with a self-hosted data plane option | Governance out of the box, if you'd rather not build the policy side |
| Helicone | strong on observability and self-hostable, but in maintenance mode after the Mintlify acquisition | Consider carefully if you'll depend on it for years |
6. OpenRouter isn't an alternative. It's a provider.
This is the most common confusion when deciding, and it costs in both directions.
OpenRouter is a hosted router: one API for hundreds of models, with failover and a single bill. It doesn't log prompts by default, offers Zero Data Retention controls that restrict routing to providers that neither store nor train on your data, and supports EU in-region routing for enterprise accounts.
Two things to know before deciding:
- There's a 1% discount for enabling prompt logging — and enabling it grants an irrevocable commercial right over those inputs and outputs. Don't enable it without reading.
- Zero retention covers content, not metadata. Token counts, latency and timestamps are still retained, and final retention depends on the downstream provider it routed to.
If your constraint is where the data goes — trade secrets, a customer confidentiality clause, a regulated sector — OpenRouter adds a hop rather than removing one. You move from "my code goes to Anthropic" to "it goes to OpenRouter and then to Anthropic". That may be acceptable, but it's one more decision to justify in an audit, not one fewer. I wrote about that class of constraint in Your AI usage policy doesn't prevent the leak.
And here's the point almost nobody makes: you don't have to choose. Declare OpenRouter as a provider inside LiteLLM.
  - model_name: broad
    litellm_params:
      model: openrouter/anthropic/claude-sonnet-5
      api_key: os.environ/OPENROUTER_API_KEY
Virtual keys, per-team caps, logging and audit on your own infrastructure. OpenRouter's model breadth for the routes allowed to leave. Routes that aren't point at a direct provider or a local model, in the same file.
The rule for what may leave the company becomes one versioned line of YAML, reviewable in a pull request. It's the best property of this whole arrangement, and it disappears if you treat the two as competitors.
7. Measure it yourself
Don't take my number. It depends on how many callbacks you enable, whether cost calculation is on, and the hardware.
This post's method is reproducible in an afternoon: stand up a local upstream that answers immediately, measure the direct path, measure the proxy path, and isolate the network hop before attributing the difference to the proxy. It's the only way to know whether the layer fits your latency budget before finding out in production.
The full stack, with the Compose file and the config, is in how to build the gateway.
How we help teams adopt AI
We work with engineering teams putting AI into the real development workflow — not as an experiment, but as an actual part of how the team ships.
That means choosing the right tools for the team's context, configuring them in a way that makes sense for the company's data policy, and making sure developers know how to use them in a way that genuinely increases productivity instead of adding friction.
If you have a development team and you're trying to put AI to work seriously, get in touch.